Performance Engineering Toolkit
Engineers are supposed to have various tools to have their routine work done in the most convenient and efficient way. And the wider expertise area the engineer has, the bigger and more diverse his toolkit is.
Performance engineering requires quite specific and dedicated skills such as: systems architecture and engineering, troubleshooting and analysis, load modeling and testing. And, to apply these skills with high efficiency, performance engineer has to be familiar with different and sophisticated set of tools.
Here is my set of tools with brief functionality description:
- JetBrains IntelliJ IDEA
- Java VisualVM
- YourKit Java Profiler
- Eclipse MAT Analyser
- IBM Thread Analyzer
- GCeasy
- Apache JMeter
- Splunk
JetBrains IntelliJ IDEA
Being a software developer you definitely know the importance of using a world-class integrated development environment (IDE).
There are a lot of disputes which IDE is better: IntelliJ or Eclipse, and someone can say that these products are equal, and your choice is a matter of taste. Wrong! Recommend him to switch to the IntelliJ due to the following objective reasons:
- intelligent debugging
- intelligent refactoring
- intelligent autocomplete
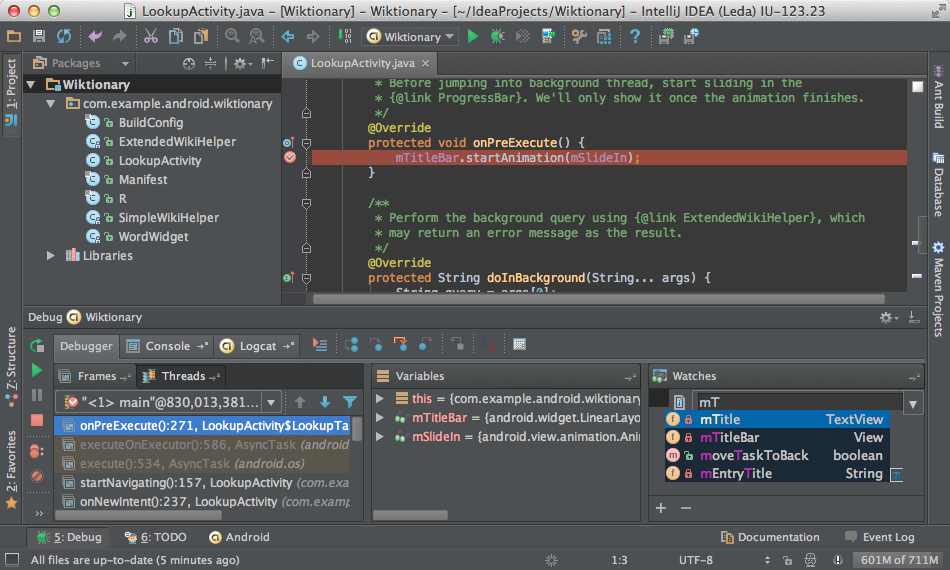
IntelliJ literally knows all about your code. It indexes all the project’s files, analyses and understands it. So, sometimes you could be really surprised how smart your IDE is.
There are a lot of plugins, and configurable settings for IntelliJ IDEA, which makes your experience unique.
Check out my current IntelliJ IDEA settings.
Java VisualVM
Java Virtual Machine is a monitoring, troubleshooting, and profiling tool which is bundled with JDK version 6.7 or later. You just need to enable your JVM (local or remote) for remote monitoring] and connect to the JVM process with the jvisualvm tool. That’s it! Now you’re able to:
- generate and analyse heap dumps
- generate and analyse thread dumps
- monitor and ask for garbage collection
- track down memory leaks
- check the current CPU and memory utilization

Another great thing about the VisualVM tool is an ability to expand the basic functionality with pluggable extensions. You can choose an already existed plugin from the Java VisualVM catalog or create your own extension depending on your needs, something like Coherence JVisualVM Plug-In.
YourKit Java Profiler
Sometimes you might need more comprehensive and intelligent Java code profiling than Java VisualVM could provide. With YourKit Java Profiler you can allow the following features not available in JDK built-in tools:
- IDE integration
- CPU profiling
- Database statement analysis
- Memory and memory leak analysis
- Remote application profiling
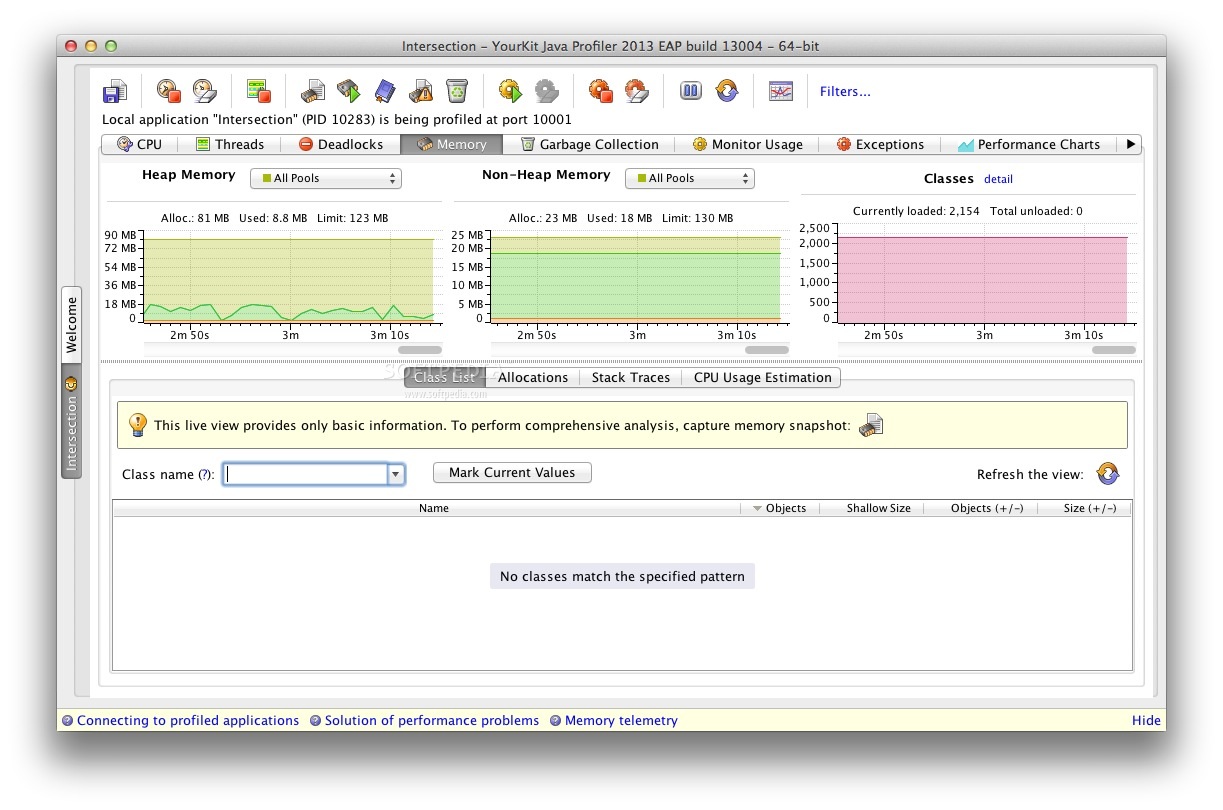
The analysis tool that comes with YourKit Java Profiler is clear and intuitive, which makes it easy to get started with the tool and find out the root cause of your performance issue.
Eclipse MAT Analyser
The Eclipse Memory Analyzer is a fast and feature-rich Java heap analyzer that helps you find memory leaks and reduce memory consumption.
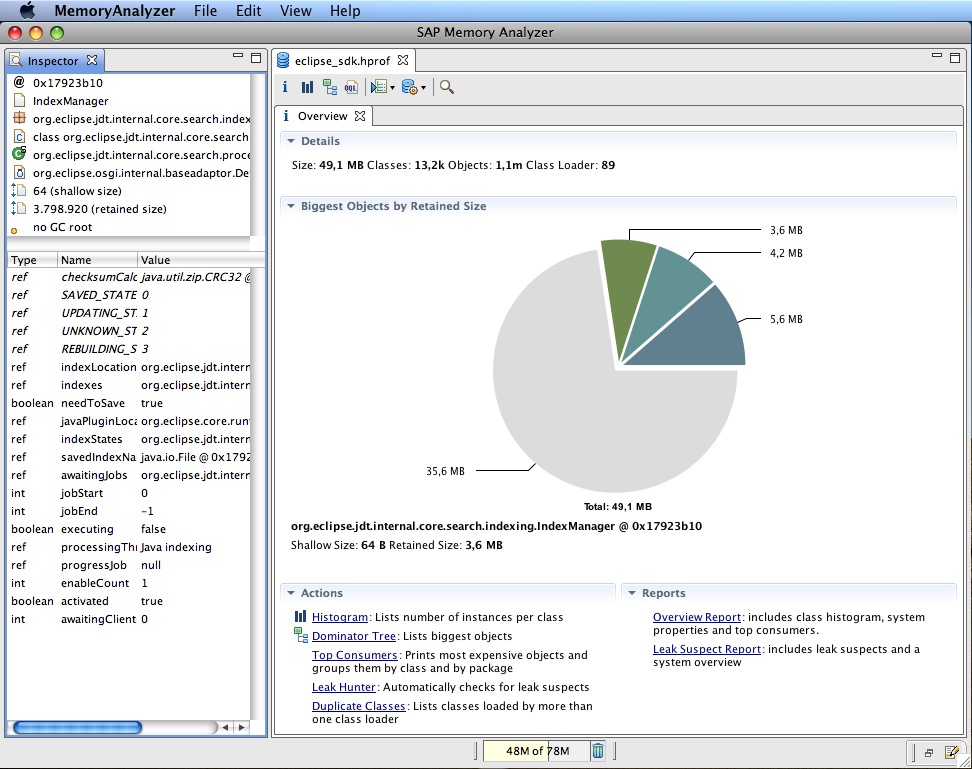
Use the Eclipse Memory Analyzer to analyze productive heap dumps with hundreds of millions of objects, quickly calculate the retained sizes of objects, see who is preventing the Garbage Collector from collecting objects, run a report to automatically extract leak suspects.
IBM Thread Analyzer
IBM Thread and Monitor Dump Analyzer could help you with javacore and thread activities analyzes in order to identify the root cause of hangs, deadlocks, and resource contention or monitor bottlenecks.
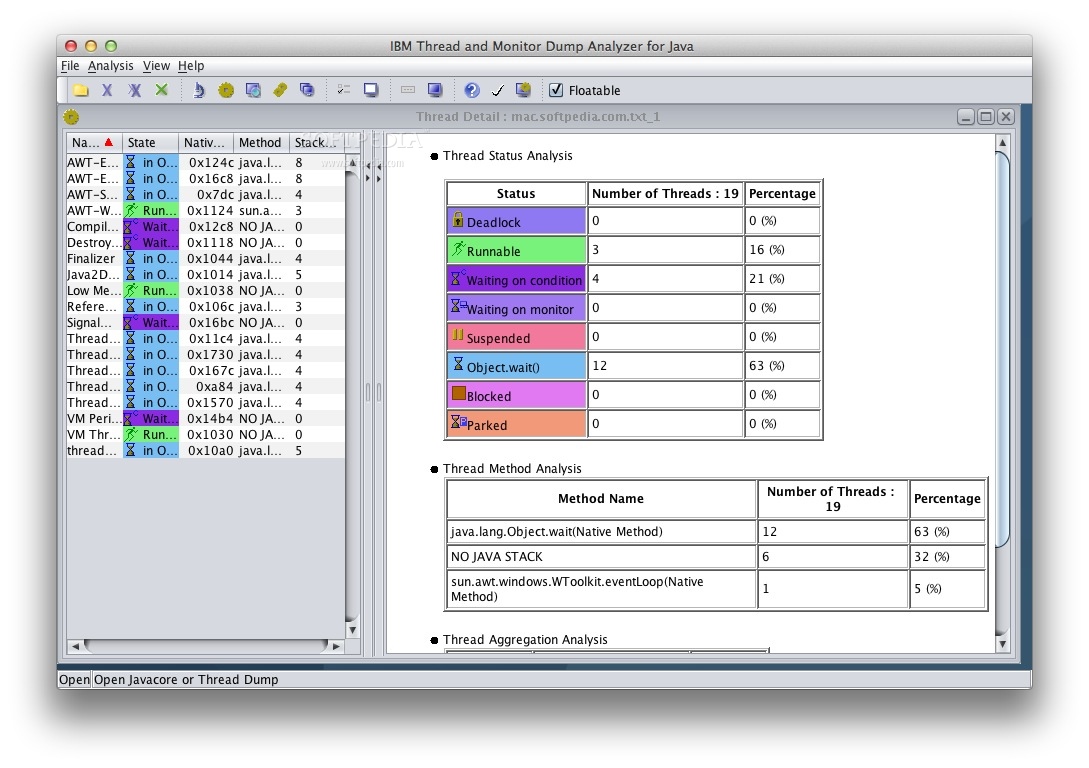
It analyzes each thread information and provides diagnostic information, such as:
- current thread information
- the signal that caused the javacore
- Java heap information
- number of runnable threads
- total number of threads
- number of monitors locked, and deadlock information
In addition, IBM Thread and Monitor Dump Analyzer could help you with recommended size of the Java heap cluster.
GCeasy
GCeasy is a great real-time garbage collection log analyser, which could help you to figure out whether your application is suffering from a memory leak or any other GC problems.
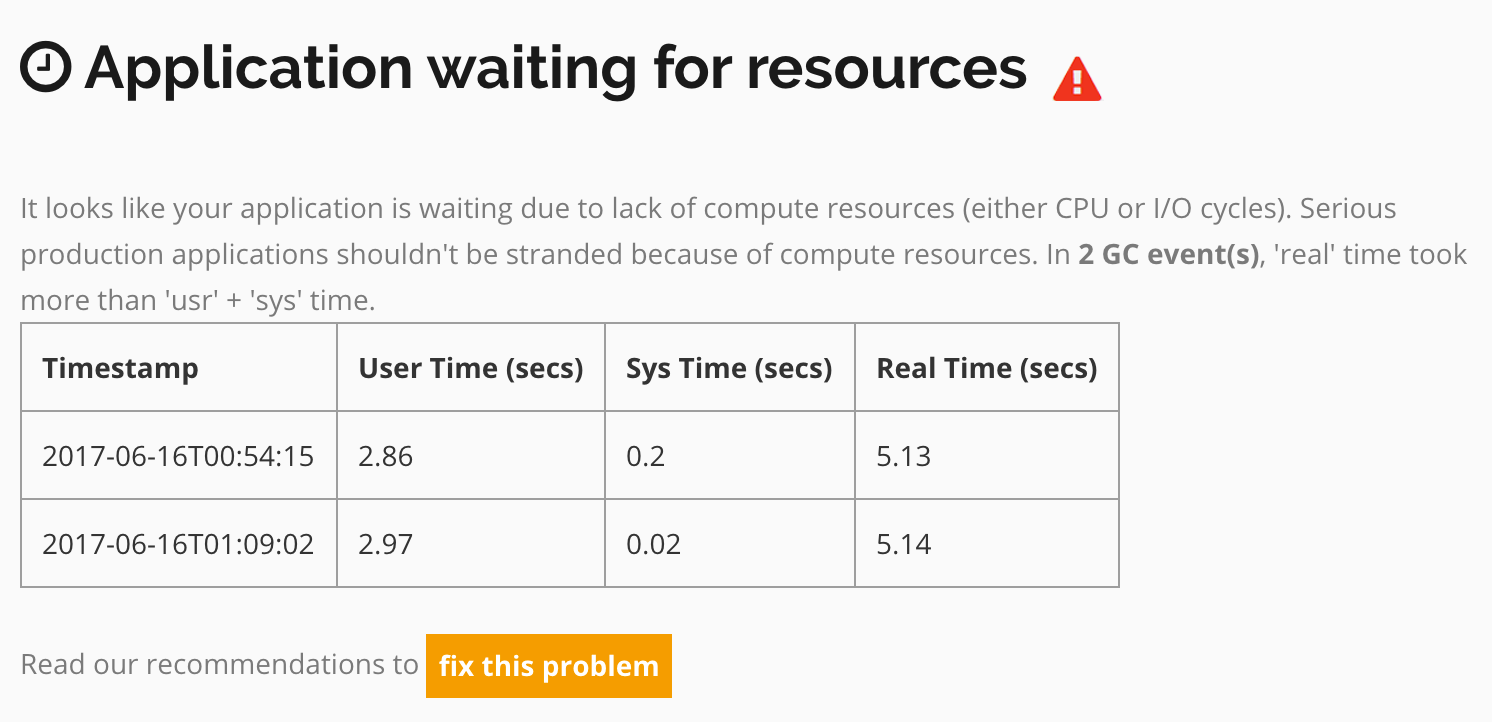
GCeasy applies several intelligence patterns to analyse your GC logs, and as a result in few seconds you can get a fancy visualized report with recommendations, key performance indicators and GC statistics section.
Apache JMeter
Identifying the current performance bottlenecks you might need to reproduce them on your local performance stand. For that purpose I use Apache JMeter - very simple and powerful open source desktop Java application, designed to load test and measure performance.
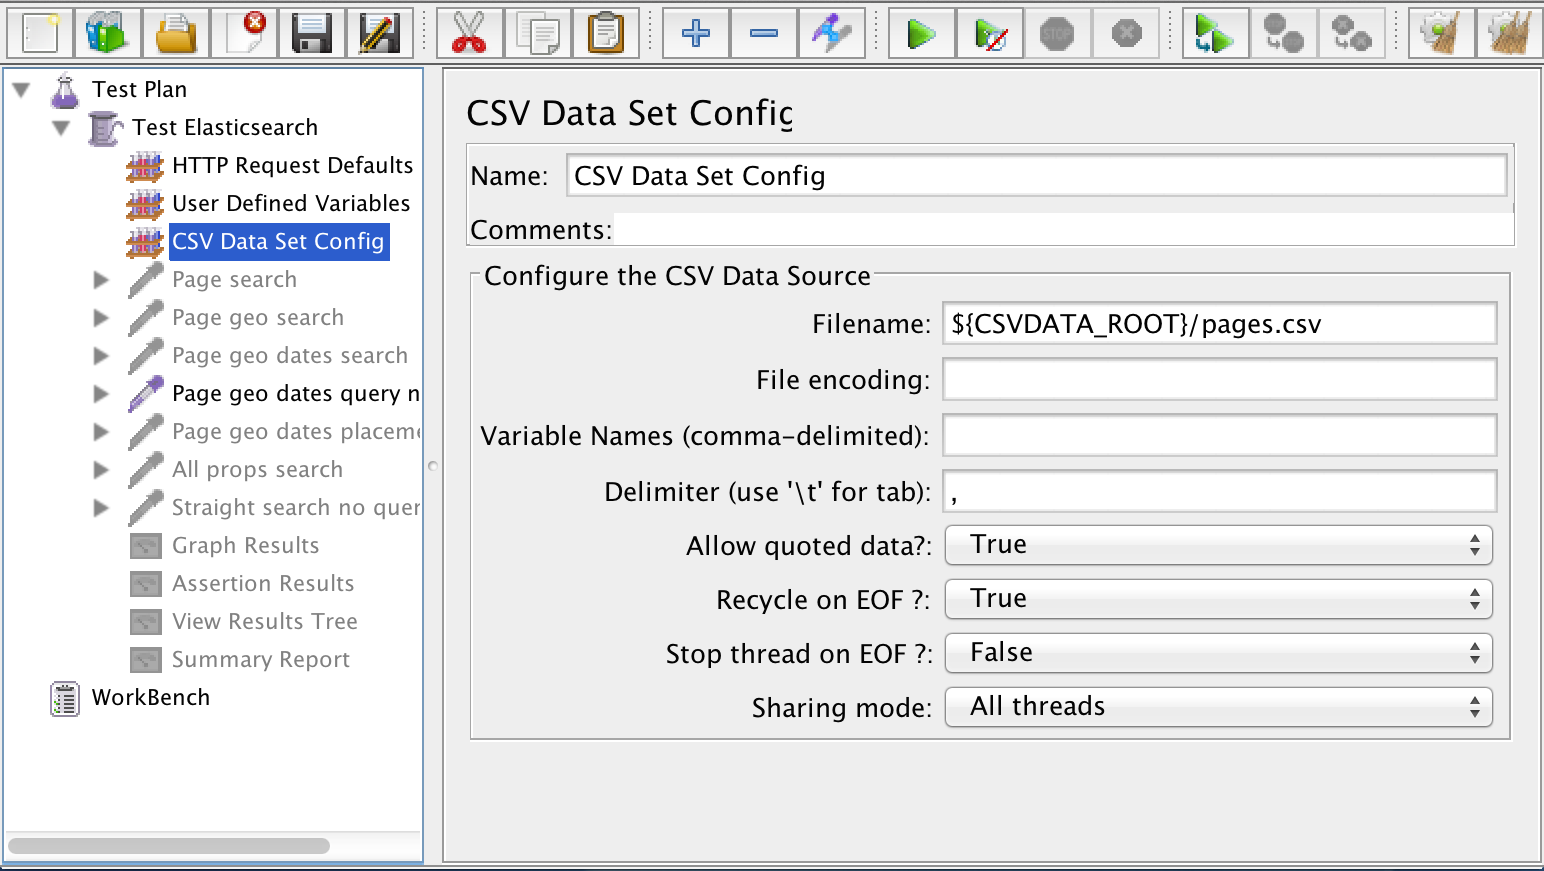
It can be used to simulate loads of various scenarios and output performance data in several ways, including CSV and XML files, and graphs.
Splunk
Analyzing a particular issue or keeping an eye on your performance trends, you often can find yourself parsing megabytes of your application’s logs. Don’t be super nerdy inventing a wheel with your homemade log parser, start using Splunk - a great solution for your logs indexing, analysis and visualization.
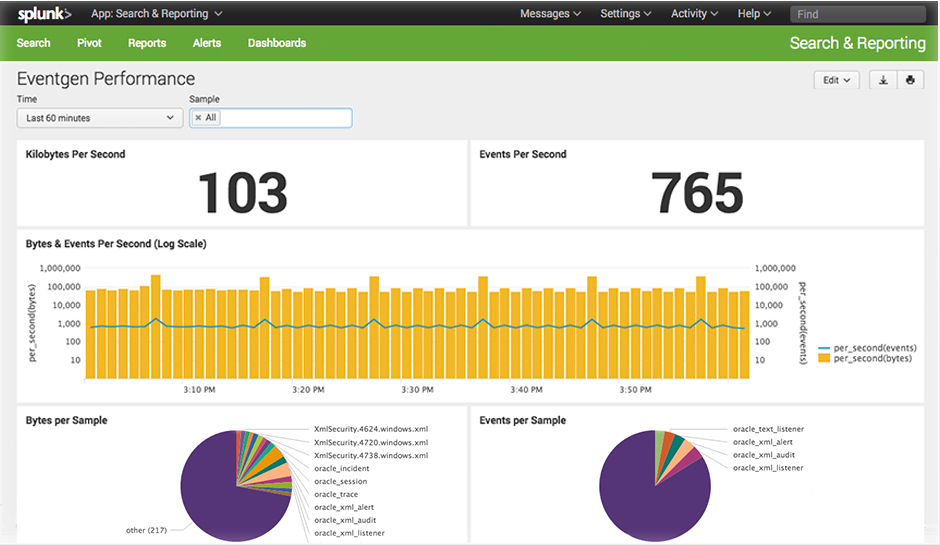
Splunk has a free version with limited functionality, and, if your logs’ volume is not exceeding 500MB per day, you can happily use this powerful tool for free.